Platform · MSP
Vehicle signal processing as a YAML graph.
MSP is the MOS4 signal-processing engine. A graph of typed kernel nodes runs continuously on-device across 21 vehicle domains. Modify a .msp.yml file and push it over a service call — no Rust recompile, no firmware flash.

Scale
226 graphs across 21 vehicle domains.
| Domain | Example graphs |
|---|---|
| Crash & impact | shock detection, FNOL trigger |
| EV battery | state of charge, degradation index |
| Fuel | consumption rate, tank level fusion |
| GNSS & road | trip segmentation, road-type classification |
| Driver behaviour | harsh braking, cornering score |
| Vibration | predictive maintenance wear index |
| Fleet | idle detection, run-hours counter |
| Voltage & power | battery health, wake-on-threshold |
| CAN bandwidth | bus-load metering, decimation |
| Temperature | thermal gradients, cabin comfort |
| Speed & kinematics | over-speed alerts, acceleration envelopes |
| Engine & powertrain | RPM analysis, torque estimation |
| Geofence events | zone-entry signal generation |
| Cargo & weight | axle-load estimation signals |
| Environment | humidity, ambient temperature |
| TPMS | tyre-pressure trend analysis |
| Diagnostics | DTC presence signal, fault correlation |
| Trailer | connect/disconnect, lighting state |
| Safety | seatbelt, door-open event |
| Maritime / off-highway | engine hours, tank signals |
Three tools
Author. Debug. Design.
The MSP development workflow spans three tools that cover the full loop: from authoring and validating a graph offline, to live debugging on a connected device, to visual editing with the kernel palette.
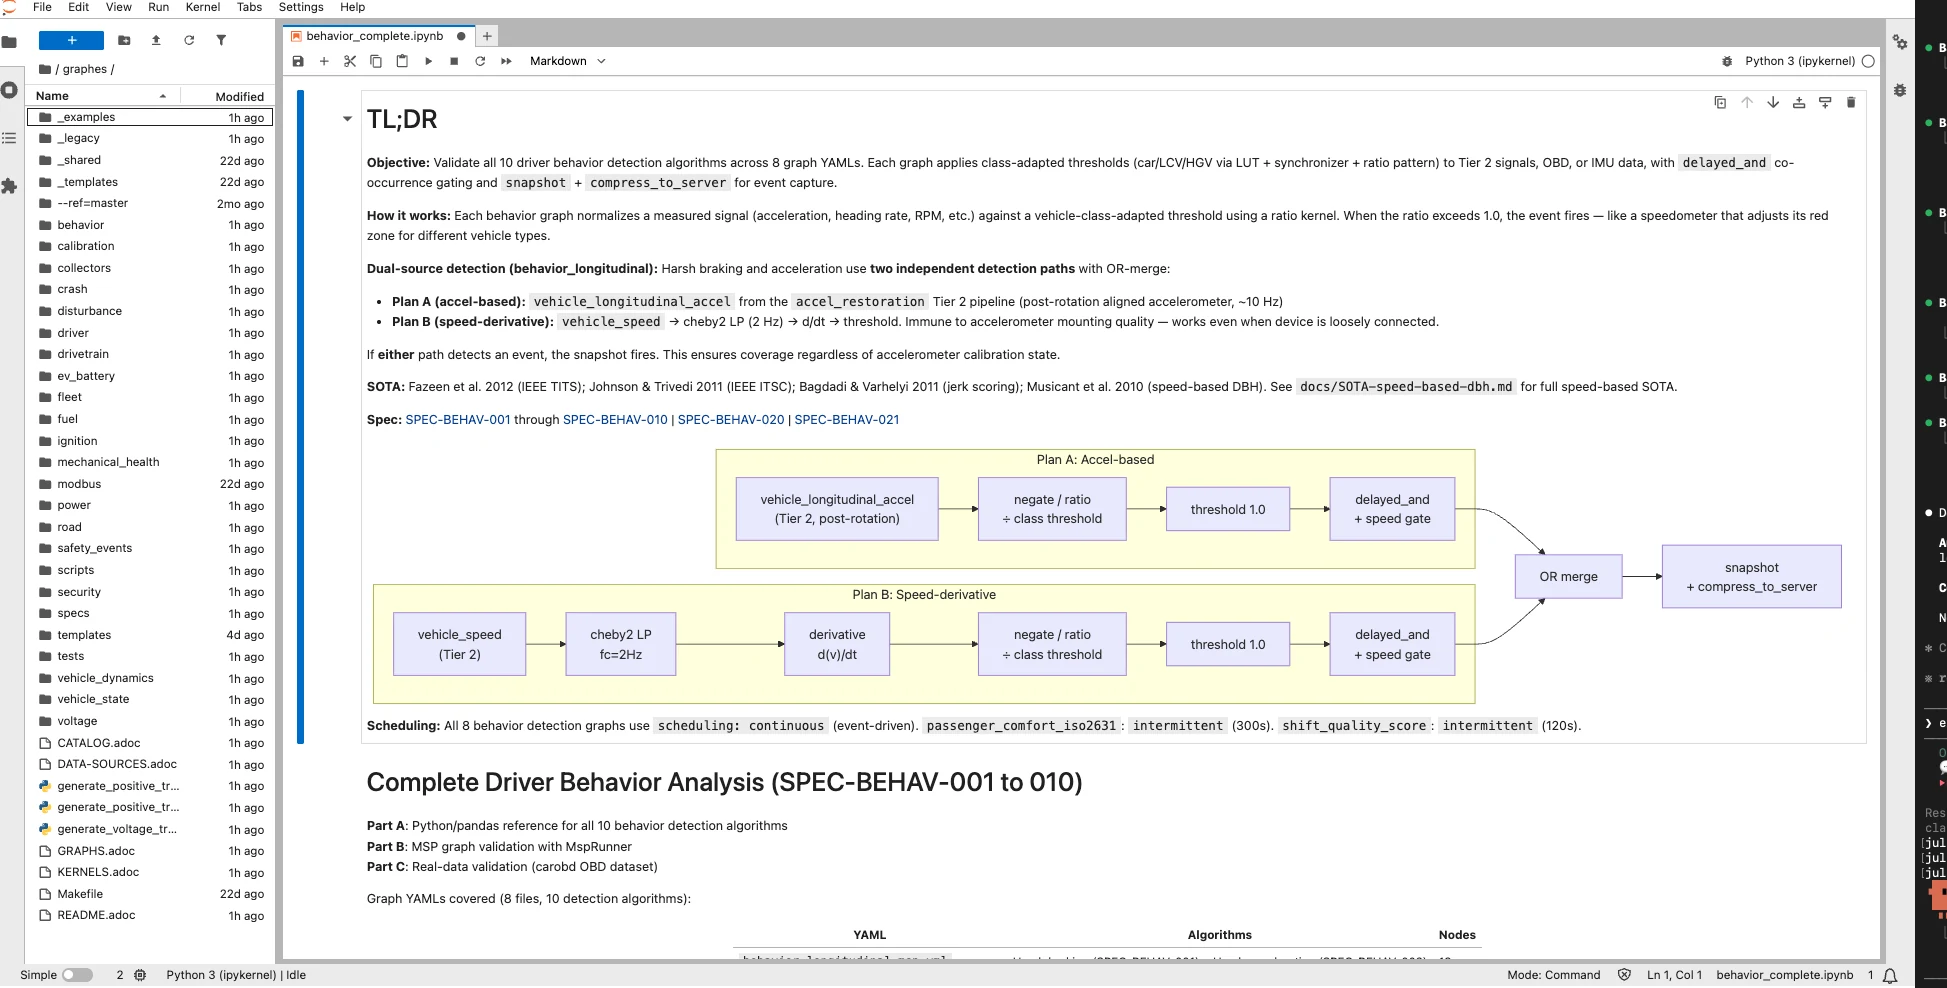
Jupyter notebook + bench harness
Author the graph in a Jupyter notebook environment. Replay it against dataset recordings,
inspect waveforms, and run the bench harness to get an F1 score per detection threshold
— plus RAM, CPU, and latency estimates — before touching a device.
Live debug — msp-visualizer
A React/TypeScript tool that lists running graphs, queries node topology, displays per-kernel benchmark times, and streams live signal samples via WebSocket. No extra tooling is required on a development device.
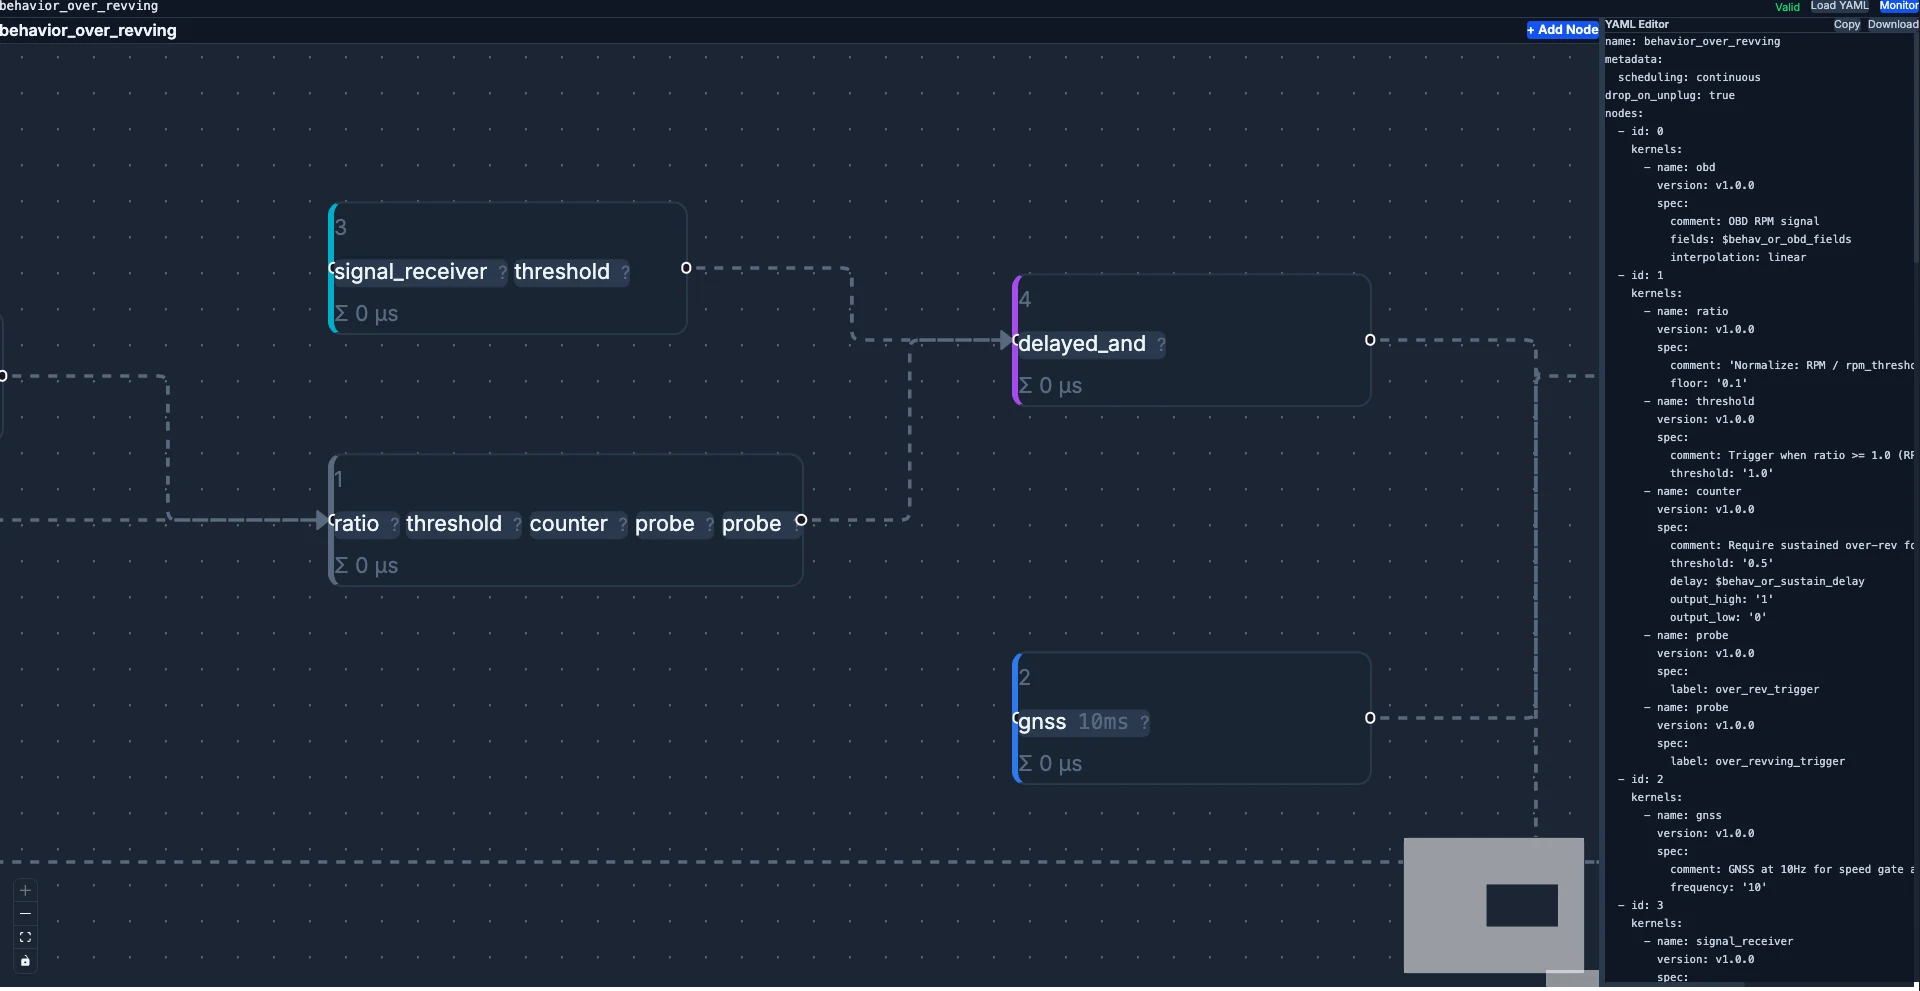
MSP designer
A browser-based canvas with a kernel palette. Drag and connect kernel nodes, validate the graph structure against the JSON schema in real time, then export the .msp.yml consumed directly by the runtime.
Send us your signal graph — we'll wire it.
Dev loop
From notebook to deployed graph — a reproducible loop.
The MSP development SOTA is a four-step cycle that closes the distance between offline authoring and on-device behaviour.
Step 1
Author and validate
Build the graph in the Jupyter environment. Replay it against dataset recordings and eyeball waveforms before committing to a YAML file.
Step 2
F1 score against benchmark dataset
Run the bench harness against a labelled dataset. Get an F1 score per detection
threshold — reproducible across runs and across engineers.
Step 3
RAM / CPU / Latency estimate
The same harness reports resource consumption. The estimate becomes the contract for the device build — no surprises after flashing.
Step 4
Deploy with expected results
Push the graph to the device over a service call. Live behaviour on-device matches the offline F1 score and resource envelope validated in Steps 2 and 3.
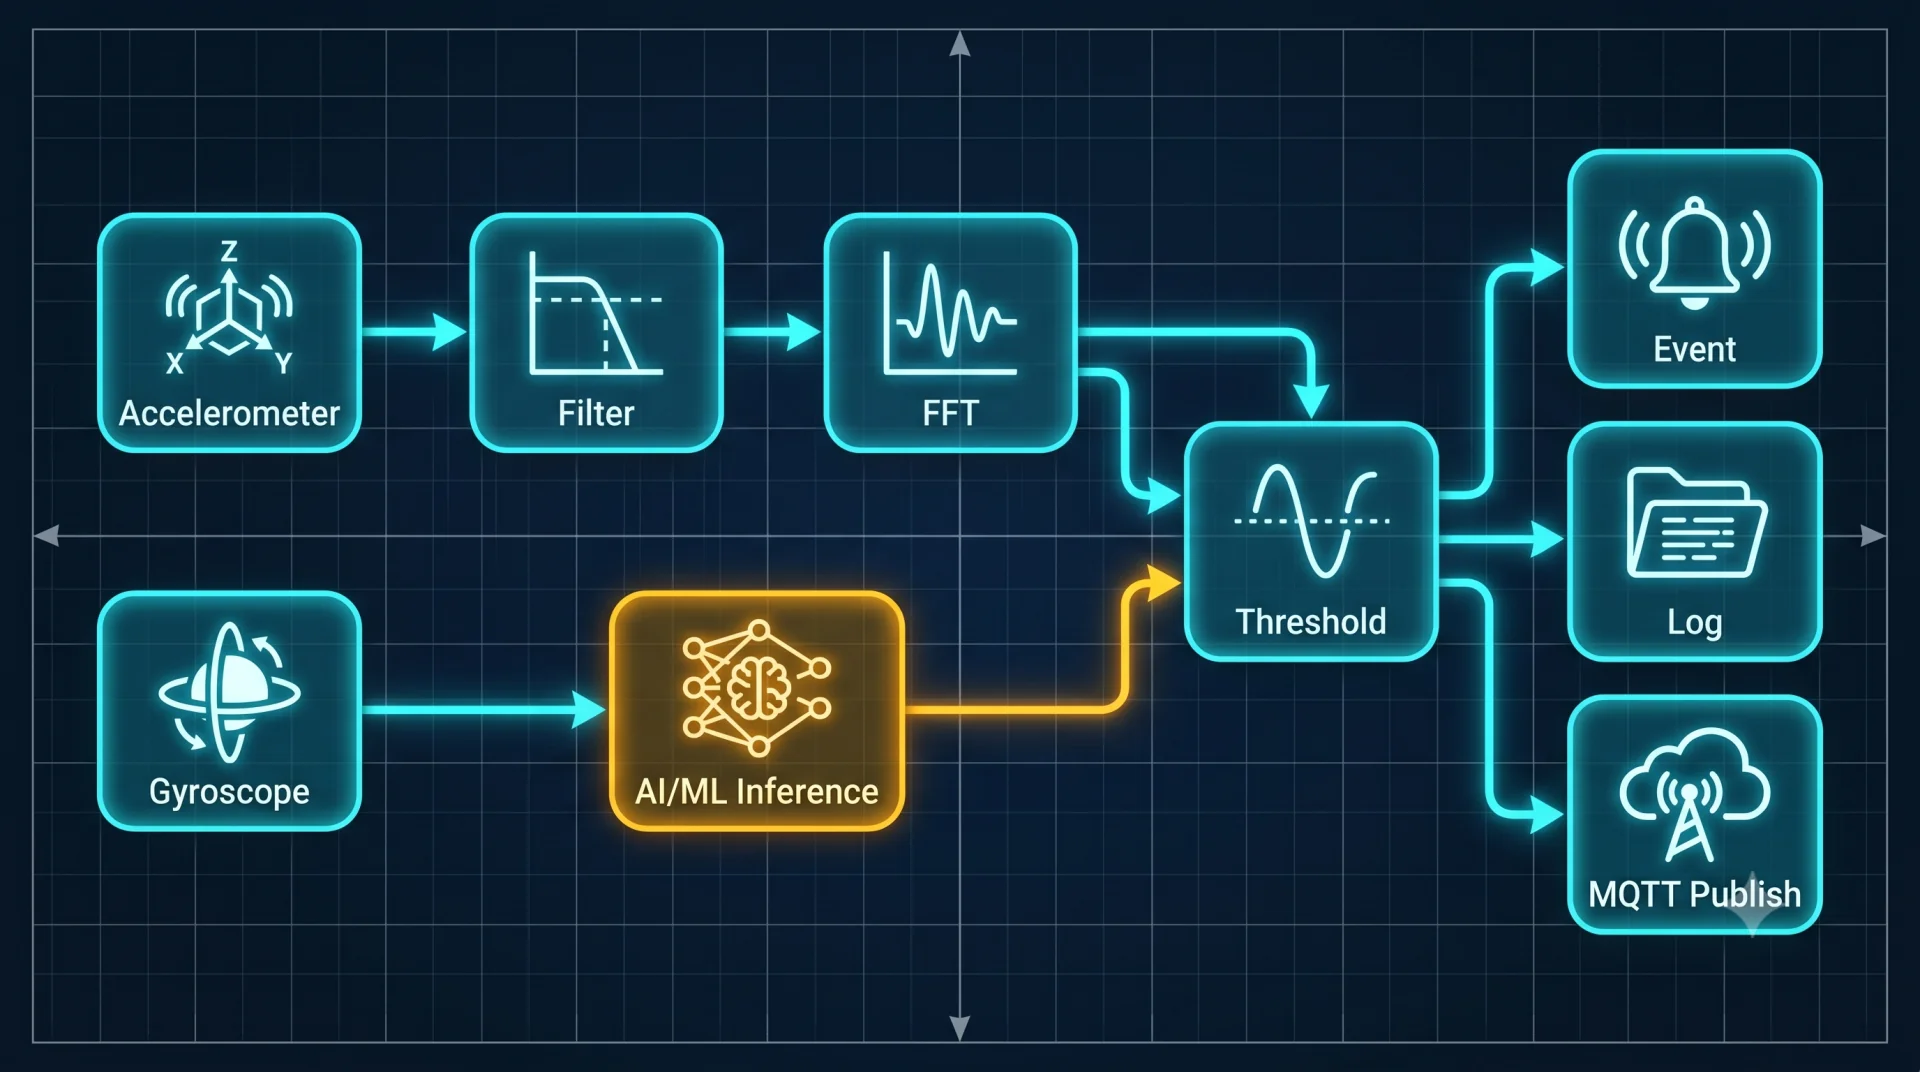
Signal architecture
Three tiers, one stable API.
A stable named-signal API connects Tier 2 and Tier 3. Tier-1 sensor and bus inputs feed Tier-2 foundation signals; Tier-3 detection graphs consume the names, not the raw streams. A new sensor or PID propagates only into Tier 1.
Three-tier MSP signal architecture. Tier 1 contains sensor and bus inputs — Multi Stacks SubscribeData, GNSS, IMU, and raw CAN frames. Tier 1 feeds Tier 2, which contains the foundation-signal layer (vehicle.speed, gnss.latitude, and others). Tier 2 feeds Tier 3, the 226 detection graphs across 21 domains — crash, harsh-brake, idle, and other domain-specific algorithms. Tier 3 publishes to three downstream consumers: the policy engine, the logs service, and the MQTT broker for cloud egress.
flowchart TB
  T1[Tier 1 — sensor and bus<br/>Multi Stacks SubscribeData<br/>GNSS · IMU · CAN frames]
  T2[Tier 2 — foundation signals<br/>vehicle.speed · gnss.latitude<br/>215+ named signals]
  T3[Tier 3 — detection graphs<br/>crash · harsh-brake · idle<br/>226 graphs, 21 domains]
  T1 --> T2 --> T3
  T3 -->|publish| MEP[mos-event-processor]
  T3 -->|publish| LG[mos-logs]
  T3 -->|publish| MQ[MQTT broker]
Runtime injection
Push a graph without a firmware flash.
| Method | Description |
|---|---|
| LoadGraph | Push a .msp.yml graph to the running runtime; no restart |
| EnableGraph | Activate a loaded graph by name |
| DisableGraph | Pause a graph; state is preserved |
| DropGraph | Remove a graph and release its resources |
| ListGraphs | Enumerate loaded graphs with lifecycle status |
| GetGraphInfo | Return the topology and kernel list for a graph |
Drive MSP from a container
LoadGraph from any MQTT client. No Rust required.
The MSP service call is reachable from a Python container over the in-process MQTT broker. A product engineer pushes a new graph from a Python script — the runtime validates and swaps it live.
Python container · LoadGraph over MQTT
# inside any Python container — no Rust toolchain
import paho.mqtt.client as mqtt, pathlib, json

graph_yaml = pathlib.Path("harsh_brake.msp.yml").read_text()

c = mqtt.Client()
c.connect("localhost", 1883)
c.publish(
    "mos/msp/LoadGraph",
    json.dumps({"name": "harsh_brake", "yaml": graph_yaml}),
)
The same service call is available from C, C++, Go, Rust — or from any language that speaks MQTT. The runtime is one container away. Explore the SDK for the full service contract.
Scheduler
Five lifecycle categories for CPU duty control.
| Category | Scheduler behaviour |
|---|---|
| always_on | Active from boot; never stopped by the scheduler |
| event_spawned | Started on a named event; auto-stopped at completion |
| confidence_gated | Runs only when input confidence exceeds threshold |
| condition_gated | Active while a DB key or signal meets a condition |
| intermittent | Periodic activation with configurable duty cycle |
The scheduler activates and auto-stops graphs based on category, keeping idle CPU load low without manual lifecycle management in application code.
Observability
Live signal tap and per-kernel benchmarks.
msp-visualizer
A React/TypeScript tool lists running graphs, queries node topology, displays per-kernel benchmark times, and streams live signal samples via WebSocket. No extra tooling is required on a development device.
Named signals as the inter-graph API
Named signals — vehicle.speed, gnss.latitude, and others — are
the stable API between graphs. Downstream graph authors consume named signals, not raw
hardware streams; sensor changes do not propagate through the graph catalog.
Kernel catalogue
124 kernel modules across 9 categories.
The kernel library covers the full range of vehicle-telemetry signal processing — from arithmetic and filter chains to GNSS geometry, event detection, and power management. Sample shown below; the full set is browsable from the MSP designer.
Math/arithmetic
18Scalar operators and time-domain accumulators.
- Absolute value
- Accumulator
- Derivative
- Integrator
- Median
- · and 13 more
Filters/DSP
23IIR/FIR filters, wavelets, resamplers, hysteresis.
- Chebyshev type-II filter
- Convolution
- DC offset remover
- Downsampler
- Hysteresis
- · and 18 more
Event detection
9Threshold and gating primitives for discrete events.
- Asymmetric debounce
- Event gate
- Peak detector
- In-band stability
- Threshold
- · and 4 more
Vehicle/sensor
10GNSS, IMU, OBD, and other sensor-side interfaces.
- GNSS source
- GNSS displacement
- GNSS distance
- Gravity estimator
- IMU stream
- · and 5 more
Codec/IO
19Compression, serialisation, CSV, and frame coders.
- bzip2 compress
- CAN-frame assemble
- CAN-frame compress
- CSV parser
- CSV writer
- · and 14 more
Time/control
10Time bases, schedulers, state machines.
- Wall-clock source
- Time-window cutter
- Database read/write
- Periodic ticker
- Signal generator
- · and 5 more
Geometry/algebra
43-D rotation, atan2, matrix builders.
- atan2
- Matrix builder
- 3-D rotation
- Rotation transform
Graph plumbing
26Pub/sub between graphs, counters, probes.
- Counter
- DB writer
- Drop
- Merge streams
- Probe
- · and 21 more
Energy/power
5Energy ratios, power classifiers, persistent integrators.
- Distance profile
- Energy ratio
- Persistent integrator
- Power classifier
- Power event publisher
Need a kernel module that is not in the catalogue? Munic adds new kernel modules per programme — talk to engineering with the algorithm and the signal contract.
In context
MSP in the MOS4 signal chain.
MSP sits between the vehicle bus and the cloud. Multi Stacks delivers raw frames; MSP transforms them into named signals; the event processor and MQTT broker carry them to the cloud.
No-code platform
MSP is one of two no-code engines in MOS4. Explore the full no-code surface alongside the event-processor and the fleet-config layer.
Multi Stacks — Tier-1 input
Multi Stacks decodes raw CAN frames and OBD PIDs and publishes them as the Tier-1 inputs that MSP graphs subscribe to.
OBDStacks — OBD signal source
OBDStacks feeds the OBD PID stream into MSP Tier-1 signals across the diagnostics and powertrain domains.
SDK — push graphs programmatically
The SDK exposes the full MSP service contract. Push, enable, and disable graphs from any container or cloud integration.
Bring the signal you want to extract.
Show us the vehicle domain and the algorithm; we'll author the graph with you on a target device of your choice.